
New project aims to create heat map of Salt Lake City, including the Westside
As part of a new project, heat tracking sensors are being used to collect heat map data around Salt Lake City, including on the Westside. Photo by Andy Cupp.
With high-tech sensors mounted on their cars, volunteers from around the area drove through Salt Lake City on a scorching July day, collecting temperature and humidity data that will be used to create new heat maps.

Map of west side routes tracked during the data collection event on July 15th. Image provided by Dr. Wei Zhang, Utah State University.
The project, led by Dr. Wei Zhang, an assistant professor of climate science at Utah State University, aims to map out areas of extreme heat across the city, including on the Westside. “There is a lack of high-resolution heat data at the street level for decision makers and the communities that are subject to this heat,” said Zhang.
A similar study was conducted in 2021 in Seattle. That study, along with the one in progress for Salt Lake City, looked primarily at heat-related vulnerabilities in the area. Zhang says these studies and the maps created from them show the spatial distribution of extreme heat in the region. This gives city, state, and federal leaders more data to use when urban planning. The data, Zhang said, could then help them determine where to plant trees, where to install cool roofs, and how to better design area parks.
Dozens of volunteers participated in the data collection on July 15th, driving on predetermined routes with their sensors. Several of these routes weaved through busy roads and small side streets throughout the Westside, passing near schools, parks, community centers, and other spaces of interest. Each of the 10 routes covered roughly 10 miles, meaning close to 100% of Salt Lake City was covered. Volunteers drove the routes during three time slots – morning, afternoon, and evening – with each drive taking roughly one hour to complete.

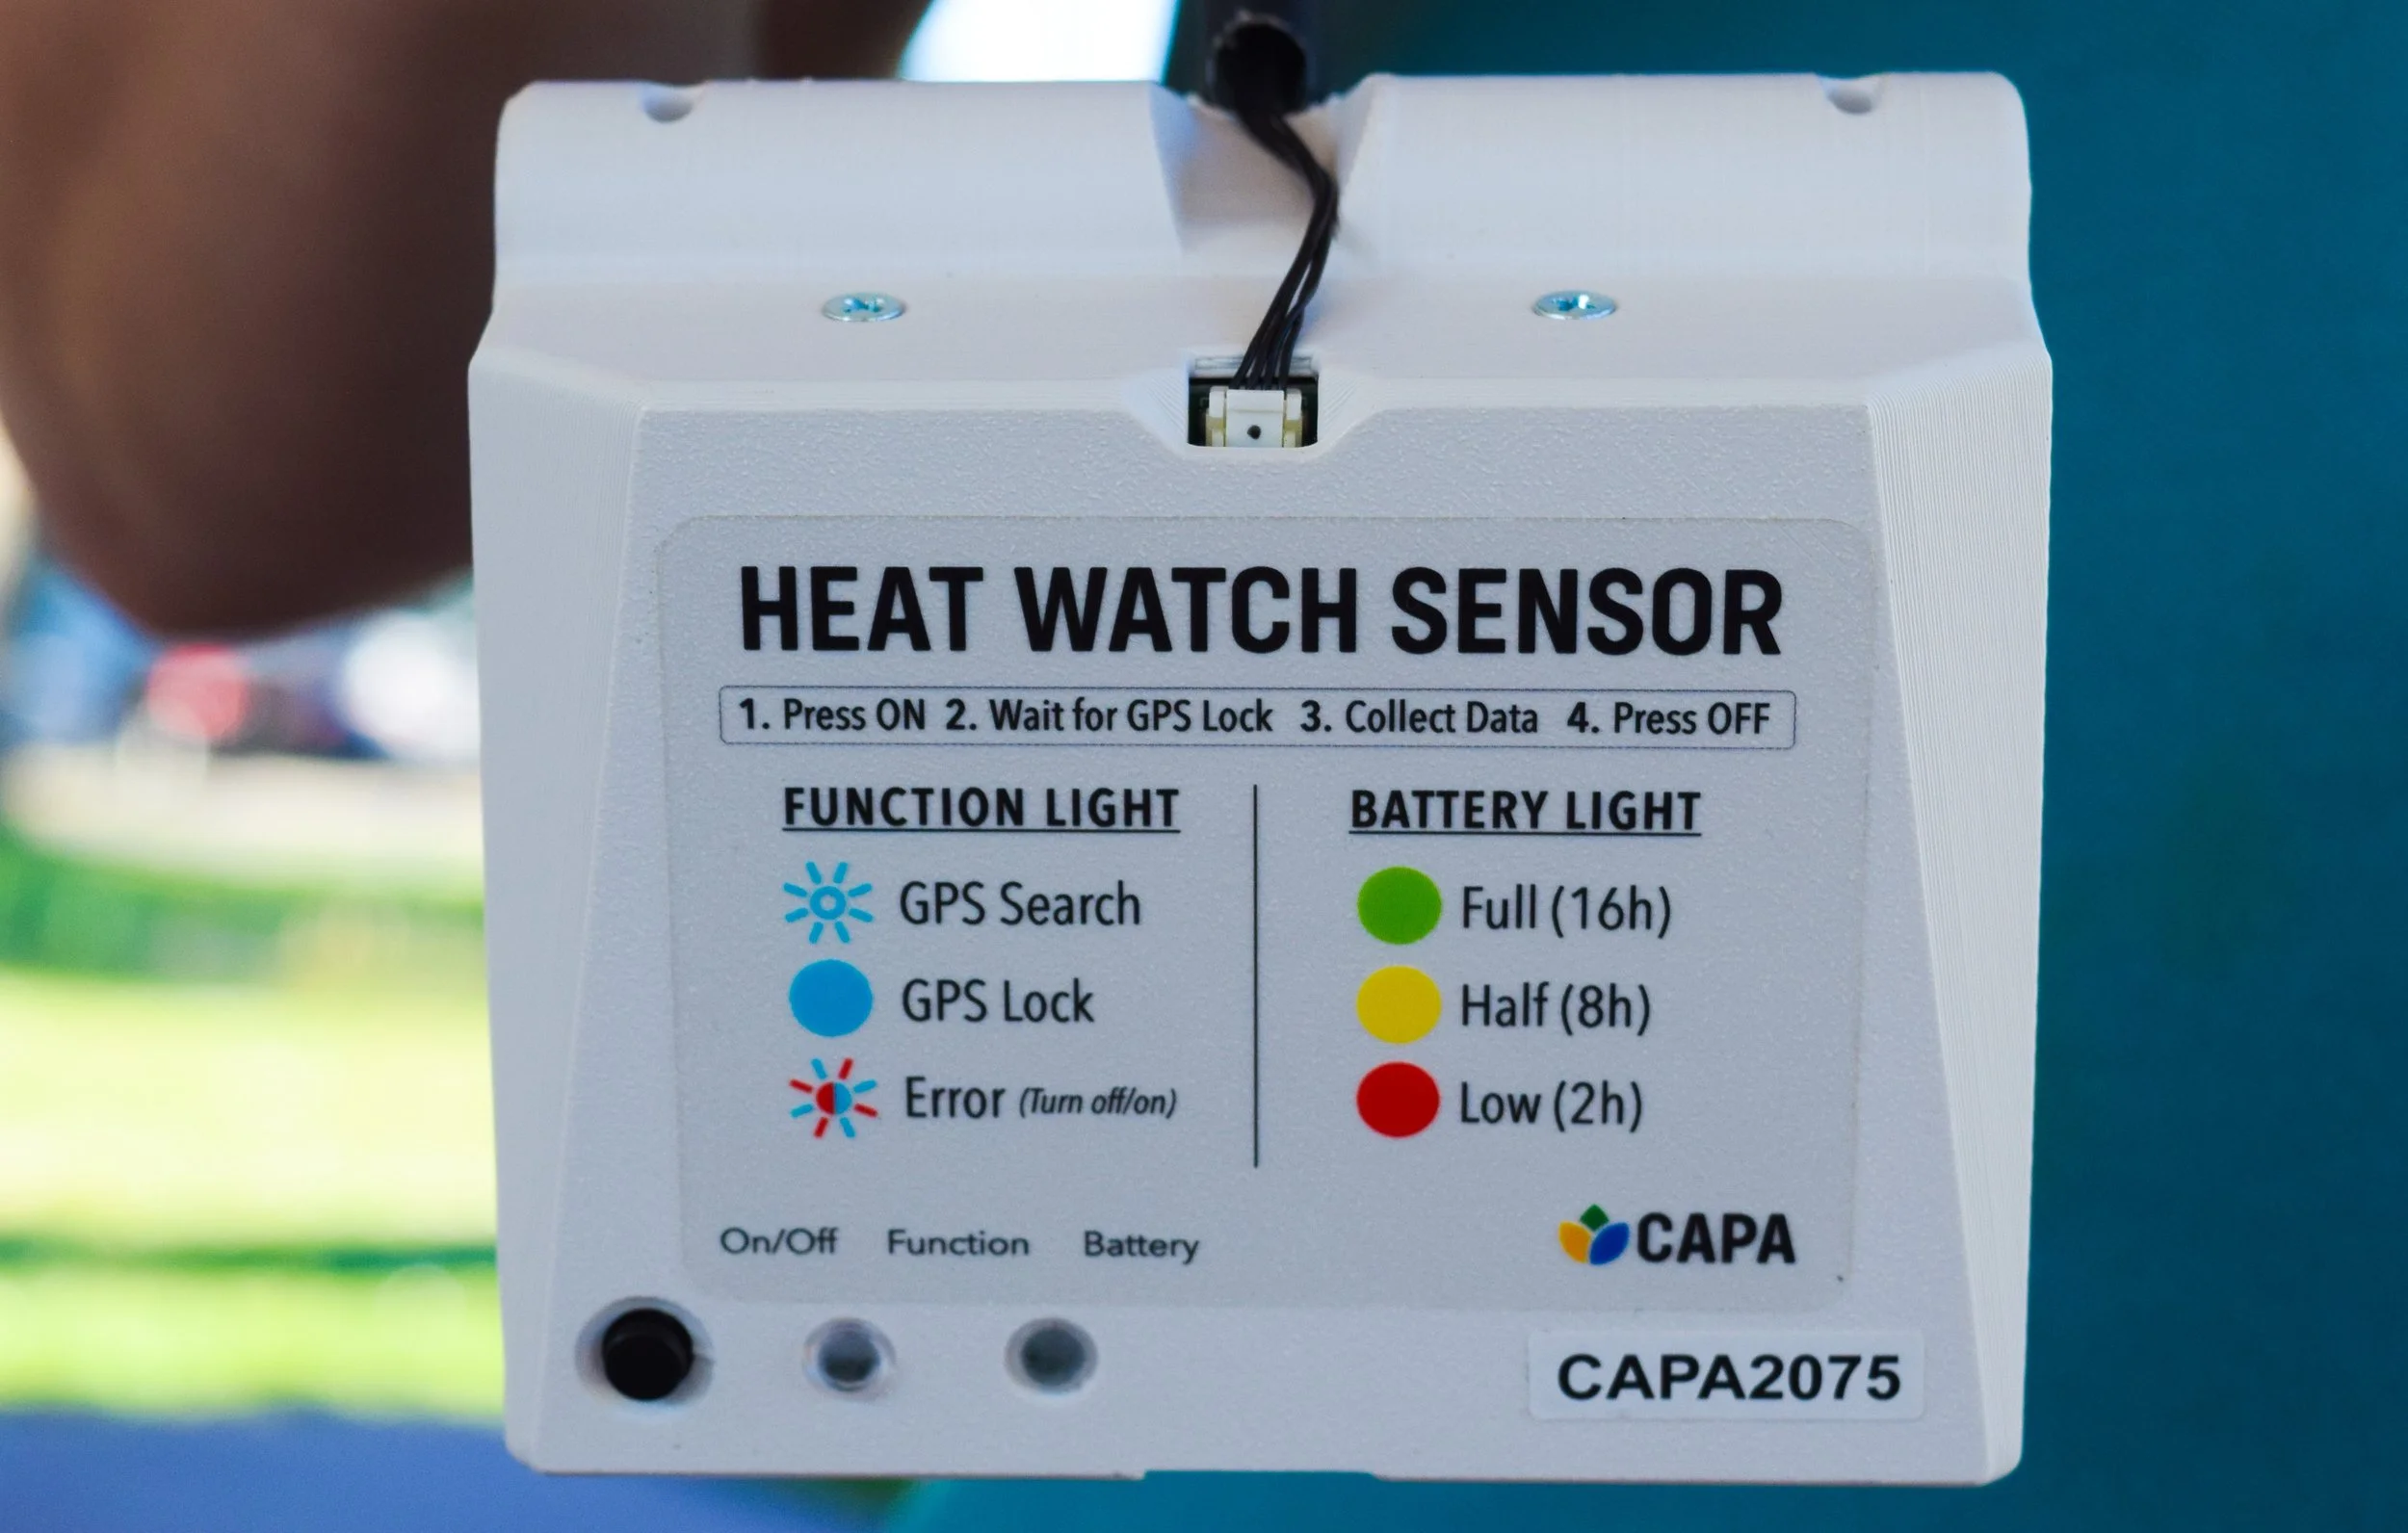
Robert Wilson, a science teacher at Rowland Hall and program coordinator for the National Oceanic and Atmospheric Administration (NOAA) heat watch program in Salt Lake City, shows volunteers how to use the heat tracking sensor. Photo by Andy Cupp.
The sensors tracked temperature and humidity every second of the drive. They also had GPS trackers in them, allowing the science team to see the exact location where temperatures may have spiked or dropped. Together, this will give the team thousands of data points to use when creating the maps.

A volunteer attaches the heat- and humidity-tracking sensor to her car in preparation for driving her assigned route in the afternoon time slot. Photo by Andy Cupp.
Robert Wilson, a science teacher at Rowland Hall and program coordinator for the National Oceanic and Atmospheric Administration (NOAA) heat watch program in Salt Lake City, said the data collected will be accessible to other government agencies in the long-term as well.
At the end of the day, all of the sensors were collected and packaged to be mailed to CAPA Strategies, an Oregon-based organization that works with NOAA. The data will be analyzed shortly thereafter, and a new heat map of the city should be available 6-8 weeks later, putting it sometime during the Fall.
Besides CAPA, NOAA, and Utah State University, other partners on this project included Rowland Hall, Salt Lake City, the National Weather Service, and the University of Utah. Heal Utah and TreeUtah also provided support for the data collection.
In addition to this heat mapping project, another study took place on the same day, looking at air quality. Sensors were attached to electric buses on five routes in the valley, and collected data all day long. While a separate project, the mapping of air quality will complement the heat mapping, showing a bigger picture of the local environment, Zhang said.